As we know, Web Intelligence is a very flexible reporting tool with advanced analytic functionalities. In this post, I’ll demonstrate how to implement a dynamic measures selection solution with Webi. Before we start, let me explain what “dynamic measures selection” is: for example, we have measures including sales quantity, sales revenue, discount amount, target sales revenue, etc. Users want to select which measures to be displayed on the report dynamically. The business background of this requirement is that for each measure, there’re actually multiple measures like this year value, last year value, variance, growth rate, etc. So displaying all measures at once may result in a too large report. So users want to just focus on some of the measures they are interested in.
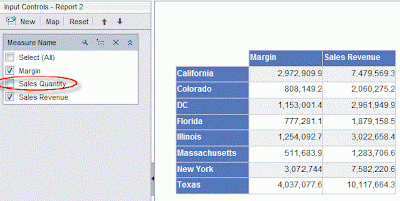
Given the powerful interactive viewer of Webi, users can drag in measures they need and format the report layout, of course. But what we need is an “interactive report” solution targeted at casual users with little IT skills, rather than power user/data analyst. So we need to create a formatted report with only very simple interactive interfaces: click the check box to select measures you want. Below is the sample report, users select measures on the left panel and measures get displayed/hidden on the right side report area:
I use following techniques to accomplish this solution:
1. Webi cross table.2. Webi Input Control (this is available since XI 3.1 SP2).3. Universe derived table.
Follow below steps to create above sample report:-
1. Build simple Universe based on eFasion connection. Add a derived table named “measure_names” with below SQL statement:
select distinct 'Sales Revenue' as mname from outlet_lookupunionselect distinct 'Sales Quantity' from outlet_lookupunionselect distinct 'Margin' from outlet_lookup
2. Create a dimension object based on the only field of above derived table. The Universe structure is shown in below figure:
3 .Create a Webi query based on this Universe, with objects: State, Measure Name, Margin, Sales Revenue and Sales Quantity. Note that in the Universe, the derived table is not joined with any other table, a Cartesian product will be resulted by this query, and this is what we want.
4. After the query run, we get the default report as below: -
5. Create a report variable named “Measure Value” with below definition:
=If([Measure Name]="Margin") Then [Margin] ElseIf([Measure Name]="Sales Quantity") Then [Sales Quantity] Else [Sales Revenue]
6. Create a Cross Table, put State object on the row, Measure Name object on the column, and Measure Value variable on cell.
7. Create an Input Control based on the Measure Name object. Choose check boxes as the control type.


No comments:
Post a Comment